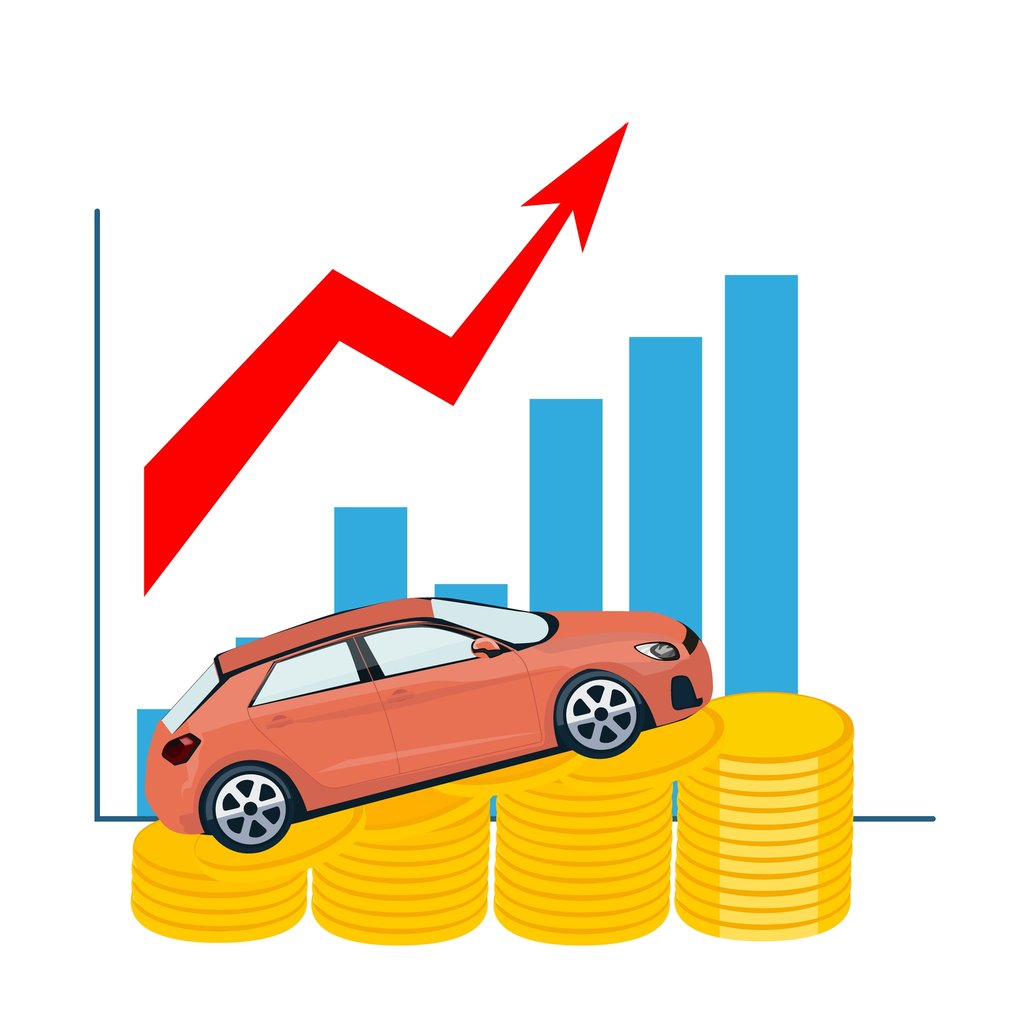
Sticker shock continues for many car buyers - as new vehicle prices again reach a record high in July. The average transaction price (ATP) for a new vehicle last month? $42,736, according to Kelley Blue Book. It marks the fourth month in a row of record high prices. KBB also reports that transaction prices were up $3,223 (8.2%) from July 2020 and increased $402 (0.9%) from June 2021.
KBB's analysts attribute the continuing price increases to two things. One is the continuing tight supply of new vehicles during the microchip shortage. At the same time, researchers say there's a big market shift going on with people buying more expensive SUVs and pickup trucks. Both are driving up new vehicle transaction prices. However, the increasing prices do seem to be impacting sales volume. KBB analysts say after robust sales in March, April and May, new-vehicle sales started slowing down in June and July. The seasonally adjusted new-vehicle sales pace in July was the slowest in a year.
"While transaction prices marked new highs in July, new-vehicle incentives continue to fall," noted Cox Automotive Analyst Kayla Reynolds. "Last month, incentives amounted to just 5.9% of ATP, the lowest amount in more than a decade. Excellent new-vehicle deals are certainly hard to find."
In July 2020, KBB reports that the average incentive amount stood at 10.1% of transaction price. Compare that to July 2021, when the average new-vehicle deal was above manufacturers' suggested retail price (MSRP).
CarProUSA Radio Show host Jerry Reynolds has warned buyers about the recent incentive drop as well.
KBB says higher transaction prices and lower incentives have combined to drive the Cox Automotive/Moody Analytics Vehicle Affordability Index into uncharted territory. New-vehicle affordability has declined through the spring and set records in each of the last two months. To put that into some perspective, KBB analysts say the number of median weeks of income needed to purchase the average new vehicle in July increased to 37.4 weeks, up from 37.2 in June.
Transaction Prices Up Across the Industry
In more KBB analysis, its researchers say that nearly every brand saw year-over-year growth in average transaction prices.
Overall, for comparison:
- Non-luxury vehicles are up 8% year-over-year price increase to $39,865
- Luxury vehicles are up 5.8% year-over-year price increase to $57,546
Cadillac prices are up 32% year-over-year, which KBB says is driven mostly by the new Escalade full-size SUV, which has been transacting above $100,000 this year. Genesis, with a new SUV in the showroom, posted year-over-year price gains of 28% for last month. Even Chevrolet and Ford delivered year-over-year gains of 14% and 15%, respectively. Porsche and Tesla were the only brands that posted price drops from year-ago levels, although KBB says the Tesla ATP is skewed because Tesla did not report price numbers for the Model S and Model X.
The segment with the single biggest price jump year-over-year might surprise you. It's the minivan market. KBB says that's thanks to some new entries from Toyota and Kia that have been driving up segment prices this year. The segment has seen a jump of nearly 17% from year-ago levels, and incentives are well below industry average.
Other vehicle segments with the largest year-over-year increases include hybrids and plug-in hybrid vehicles, luxury full-size SUVs and mid-size cars.
Check out the ATP data compiled by Kelley Blue Book below.
|
Manufacturer |
July 2021 Transaction |
June 2021 Transaction |
July 2020 |
% Change June |
% Change |
|
American Honda (Acura, Honda) |
$33,775 |
$33,077 |
$30,125 |
2.1% |
12.1% |
|
BMW Group |
$57,006 |
$58,599 |
$55,419 |
-2.7% |
2.9% |
|
Daimler |
$68,748 |
$65,959 |
$63,708 |
4.2% |
7.9% |
|
Stellantis (Alfa Romeo, Chrysler, Dodge, Fiat, Jeep, RAM) |
$48,984 |
$49,774 |
$43,386 |
-1.6% |
12.9% |
|
Ford Motor Company (Ford, Lincoln) |
$52,356 |
$50,358 |
$45,851 |
4.0% |
14.2% |
|
General Motors (Buick, Cadillac, Chevrolet, GMC) |
$49,335 |
$48,697 |
$43,029 |
1.3% |
14.7% |
|
Hyundai Kia |
$32,411 |
$31,789 |
$28,956 |
2.0% |
11.9% |
|
Mazda |
$32,561 |
$31,562 |
$29,592 |
3.2% |
10.0% |
|
Mitsubishi |
$27,102 |
$26,609 |
$23,854 |
1.9% |
13.6% |
|
Nissan North America (Nissan, INFINITI) |
$33,174 |
$32,721 |
$31,526 |
1.4% |
5.2% |
|
Subaru |
$34,551 |
$35,193 |
$31,843 |
-1.8% |
8.5% |
|
Tesla Motors** |
$49,001 |
$47,780 |
$54,830 |
2.6% |
-10.6% |
|
Toyota Motor Company (Lexus, Toyota) |
$38,352 |
$38,370 |
$36,070 |
0.0% |
6.3% |
|
Volkswagen Group (Audi, Volkswagen, Porsche) |
$48,700 |
$48,982 |
$45,171 |
-0.6% |
7.8% |
|
Volvo North America |
$55,811 |
$53,125 |
$48,606 |
5.1% |
14.8% |
|
Industry |
$42,736 |
$42,334 |
$39,512 |
0.9% |
8.2% |
|
*Kelley Blue Book average transaction prices do not include all applied consumer incentives. **Tesla Motors did not report price numbers for two of its models (Model S and Model X). This heavily skewed the manufacturer's average transaction price comparisons year-over-year and month-over-month. |
|||||
|
|
|
|
|
|
|
|
|
|||||
|
Makes
|
July 2021 Transaction |
June 2021 Transaction |
July 2020 |
% Change June July 2021* |
% Change 2020 to |
|
Acura |
$45,702 |
$45,223 |
$40,304 |
1.1% |
13.4% |
|
Alfa Romeo |
$48,211 |
$47,725 |
$45,589 |
1.0% |
5.8% |
|
Audi |
$59,704 |
$58,635 |
$55,964 |
1.8% |
6.7% |
|
BMW |
$59,378 |
$60,904 |
$58,799 |
-2.5% |
1.0% |
|
Buick |
$36,106 |
$36,393 |
$32,560 |
-0.8% |
10.9% |
|
Cadillac |
$75,375 |
$68,921 |
$56,756 |
9.4% |
32.8% |
|
Chevrolet |
$46,208 |
$46,233 |
$40,726 |
-0.1% |
13.5% |
|
Chrysler |
$42,650 |
$41,002 |
$39,289 |
4.0% |
8.6% |
|
Dodge |
$44,464 |
$43,750 |
$38,610 |
1.6% |
15.2% |
|
Fiat |
$28,672 |
$28,271 |
$27,952 |
1.4% |
2.6% |
|
Ford |
$51,828 |
$49,690 |
$45,235 |
4.3% |
14.6% |
|
Genesis |
$60,096 |
$59,226 |
$47,056 |
1.5% |
27.7% |
|
GMC |
$56,938 |
$55,288 |
$52,081 |
3.0% |
9.3% |
|
Honda |
$32,307 |
$31,671 |
$28,940 |
2.0% |
11.6% |
|
Hyundai |
$31,320 |
$30,740 |
$29,349 |
1.9% |
6.7% |
|
Infiniti |
$52,227 |
$51,018 |
$46,087 |
2.4% |
13.3% |
|
Jaguar |
$67,112 |
$65,891 |
$59,574 |
1.9% |
12.7% |
|
Jeep |
$46,052 |
$46,066 |
$39,876 |
0.0% |
15.5% |
|
Kia |
$31,430 |
$31,275 |
$28,091 |
0.5% |
11.9% |
|
Land Rover |
$83,174 |
$84,101 |
$80,469 |
-1.1% |
3.4% |
|
Lexus |
$51,490 |
$51,394 |
$49,734 |
0.2% |
3.5% |
|
Lincoln |
$66,631 |
$65,301 |
$57,736 |
2.0% |
15.4% |
|
Mazda |
$32,561 |
$31,562 |
$29,592 |
3.2% |
10.0% |
|
Mercedes-Benz |
$68,748 |
$65,959 |
$63,708 |
4.2% |
7.9% |
|
Mini |
$35,566 |
$34,627 |
$33,193 |
2.7% |
7.1% |
|
Mitsubishi |
$27,102 |
$26,609 |
$23,854 |
1.9% |
13.6% |
|
Nissan |
$32,117 |
$31,559 |
$30,133 |
1.8% |
6.6% |
|
Porsche |
$95,534 |
$101,899 |
$96,795 |
-6.2% |
-1.3% |
|
Ram |
$55,322 |
$55,816 |
$50,596 |
-0.9% |
9.3% |
|
Subaru |
$34,551 |
$35,193 |
$31,843 |
-1.8% |
8.5% |
|
Tesla** |
$49,001 |
$47,780 |
$54,830 |
2.6% |
-10.6% |
|
Toyota |
$36,240 |
$36,444 |
$33,877 |
-0.6% |
7.0% |
|
Volkswagen |
$34,402 |
$34,046 |
$29,488 |
1.0% |
16.7% |
|
Volvo |
$55,756 |
$53,081 |
$48,606 |
5.0% |
14.7% |
|
Industry |
$42,736 |
$42,334 |
$39,512 |
0.9% |
8.2% |
|
*Kelley Blue Book average transaction prices do not include applied consumer incentives. **Tesla Motors did not report price numbers for two of its models (Model S and Model X). This heavily skewed the manufacturer's average transaction price comparisons year-over-year and month-over-month. |
|||||
Source: Kelley Blue Book Press Release
Photo Credit: Julia Shamayaeva/Shutterstock.com